How to view your web browsers developer tools and error console
Most modern browsers have a JavaScript error console built-in, usually within the developer tools functionality. This guide explains how to view it in the most common browsers.
It can be a useful tool in your armoury when fault-finding issues with pages not displaying how you expect or features of your website not working.
Firefox
The developer tools and console can be accessed in a number of ways:
Keyboard shortcuts
PC - **Ctrl** + **Shift** + **K** - takes you directly to the Console tab of the developer tools.
Mac - **Cmd** + **Option** + **K** - takes you directly to the Console tab of the developer tools.
Pressing the **F12** key which displays the developer tools - then click the Console tab.
By selecting from the menu:
Click the three-line hamburger menu and select Web Developer

Then in the next menu click Web Console

Click the Console tab to view the output. You can use the filter to search for a specific output, or the filter buttons to view just Errors, Warnings etc.

Chrome
The developer tools and console can be accessed in a number of ways:
Keyboard shortcuts
PC - **Ctrl** + **Shift** + **I** or pressing **F12** displays the developer tools - then click the Console tab.
Mac - **Cmd** + **Option** + **I** or pressing **F12** displays the developer tools - then click the Console tab.
By selecting from the menu:

Click the three-dot hamburger menu and select More Tools and then click Developer Tools on the next menu and then finally select the Console Tab.

Edge
The developer tools and console can be accessed in a number of ways:
Keyboard shortcuts - pressing **F12** displays the developer tools - then click the Console tab.
By selecting from the menu:

Click the three-dot menu and select More Tools and then click Developer Tools on the next menu and then finally select the Console Tab.

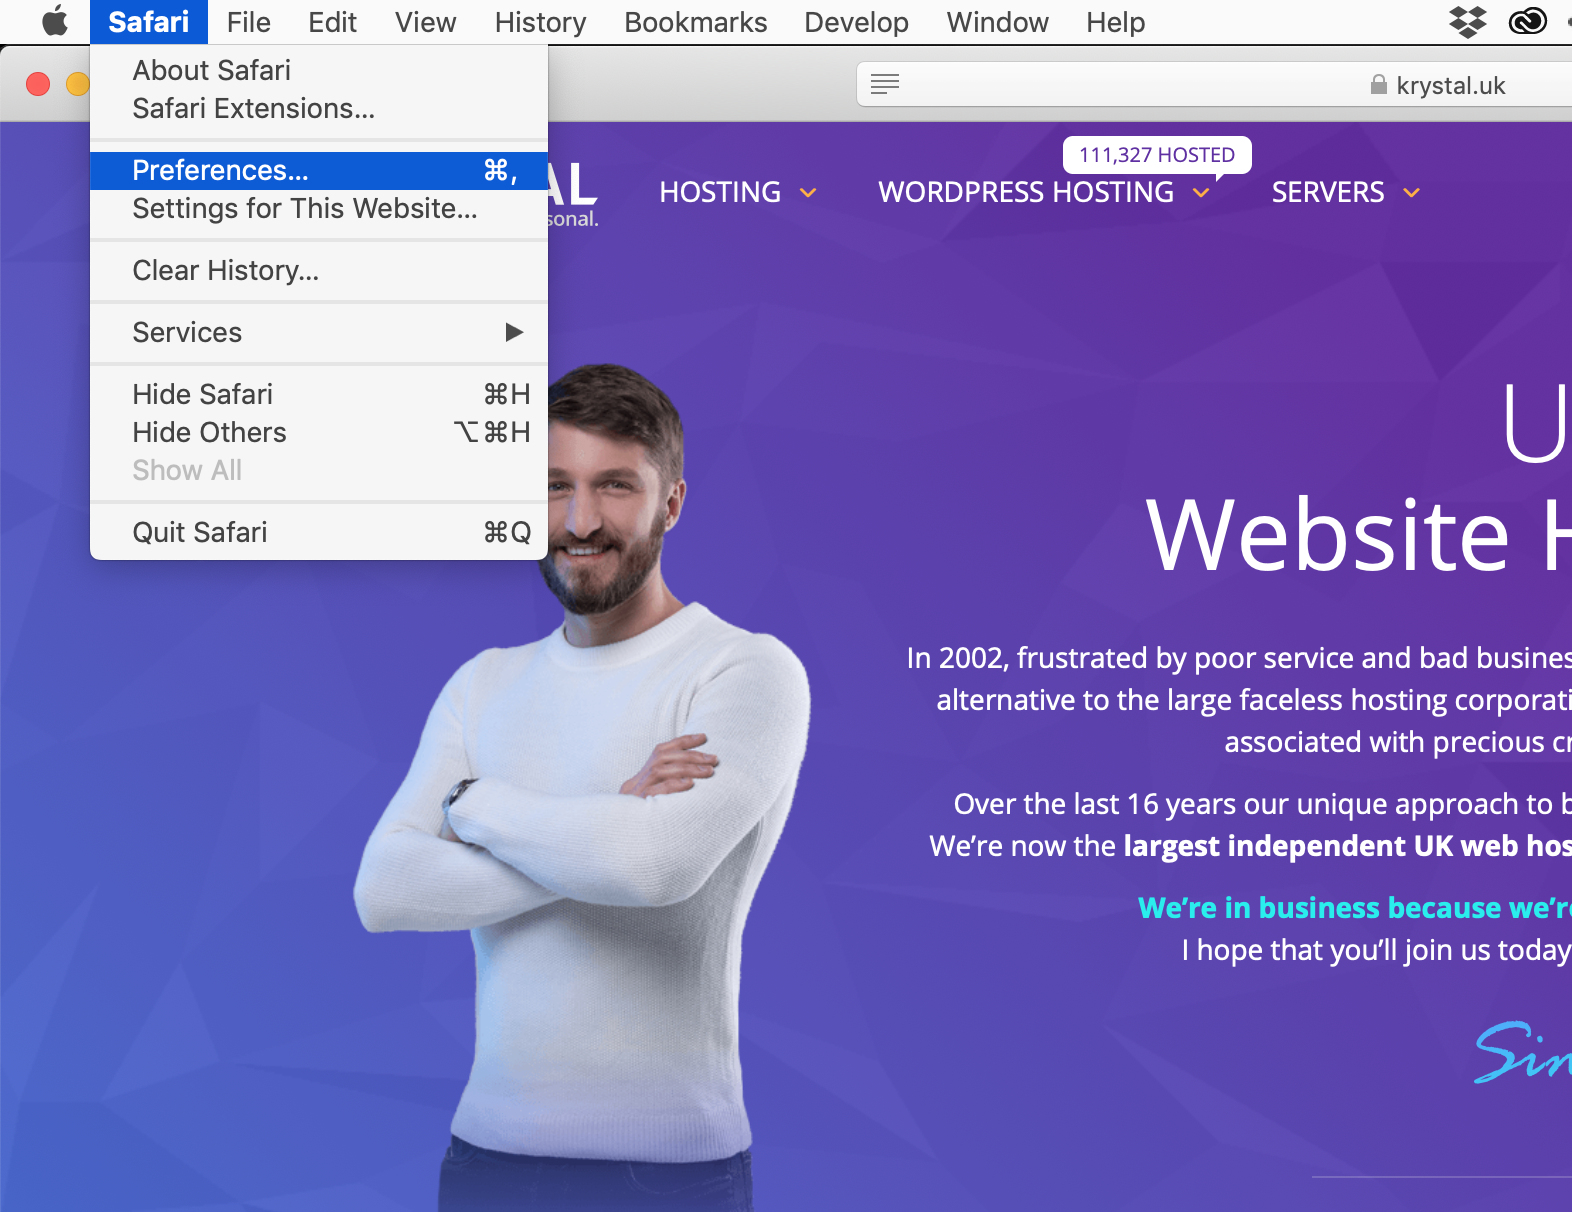
Safari
- Select Preferences from the Safari menu
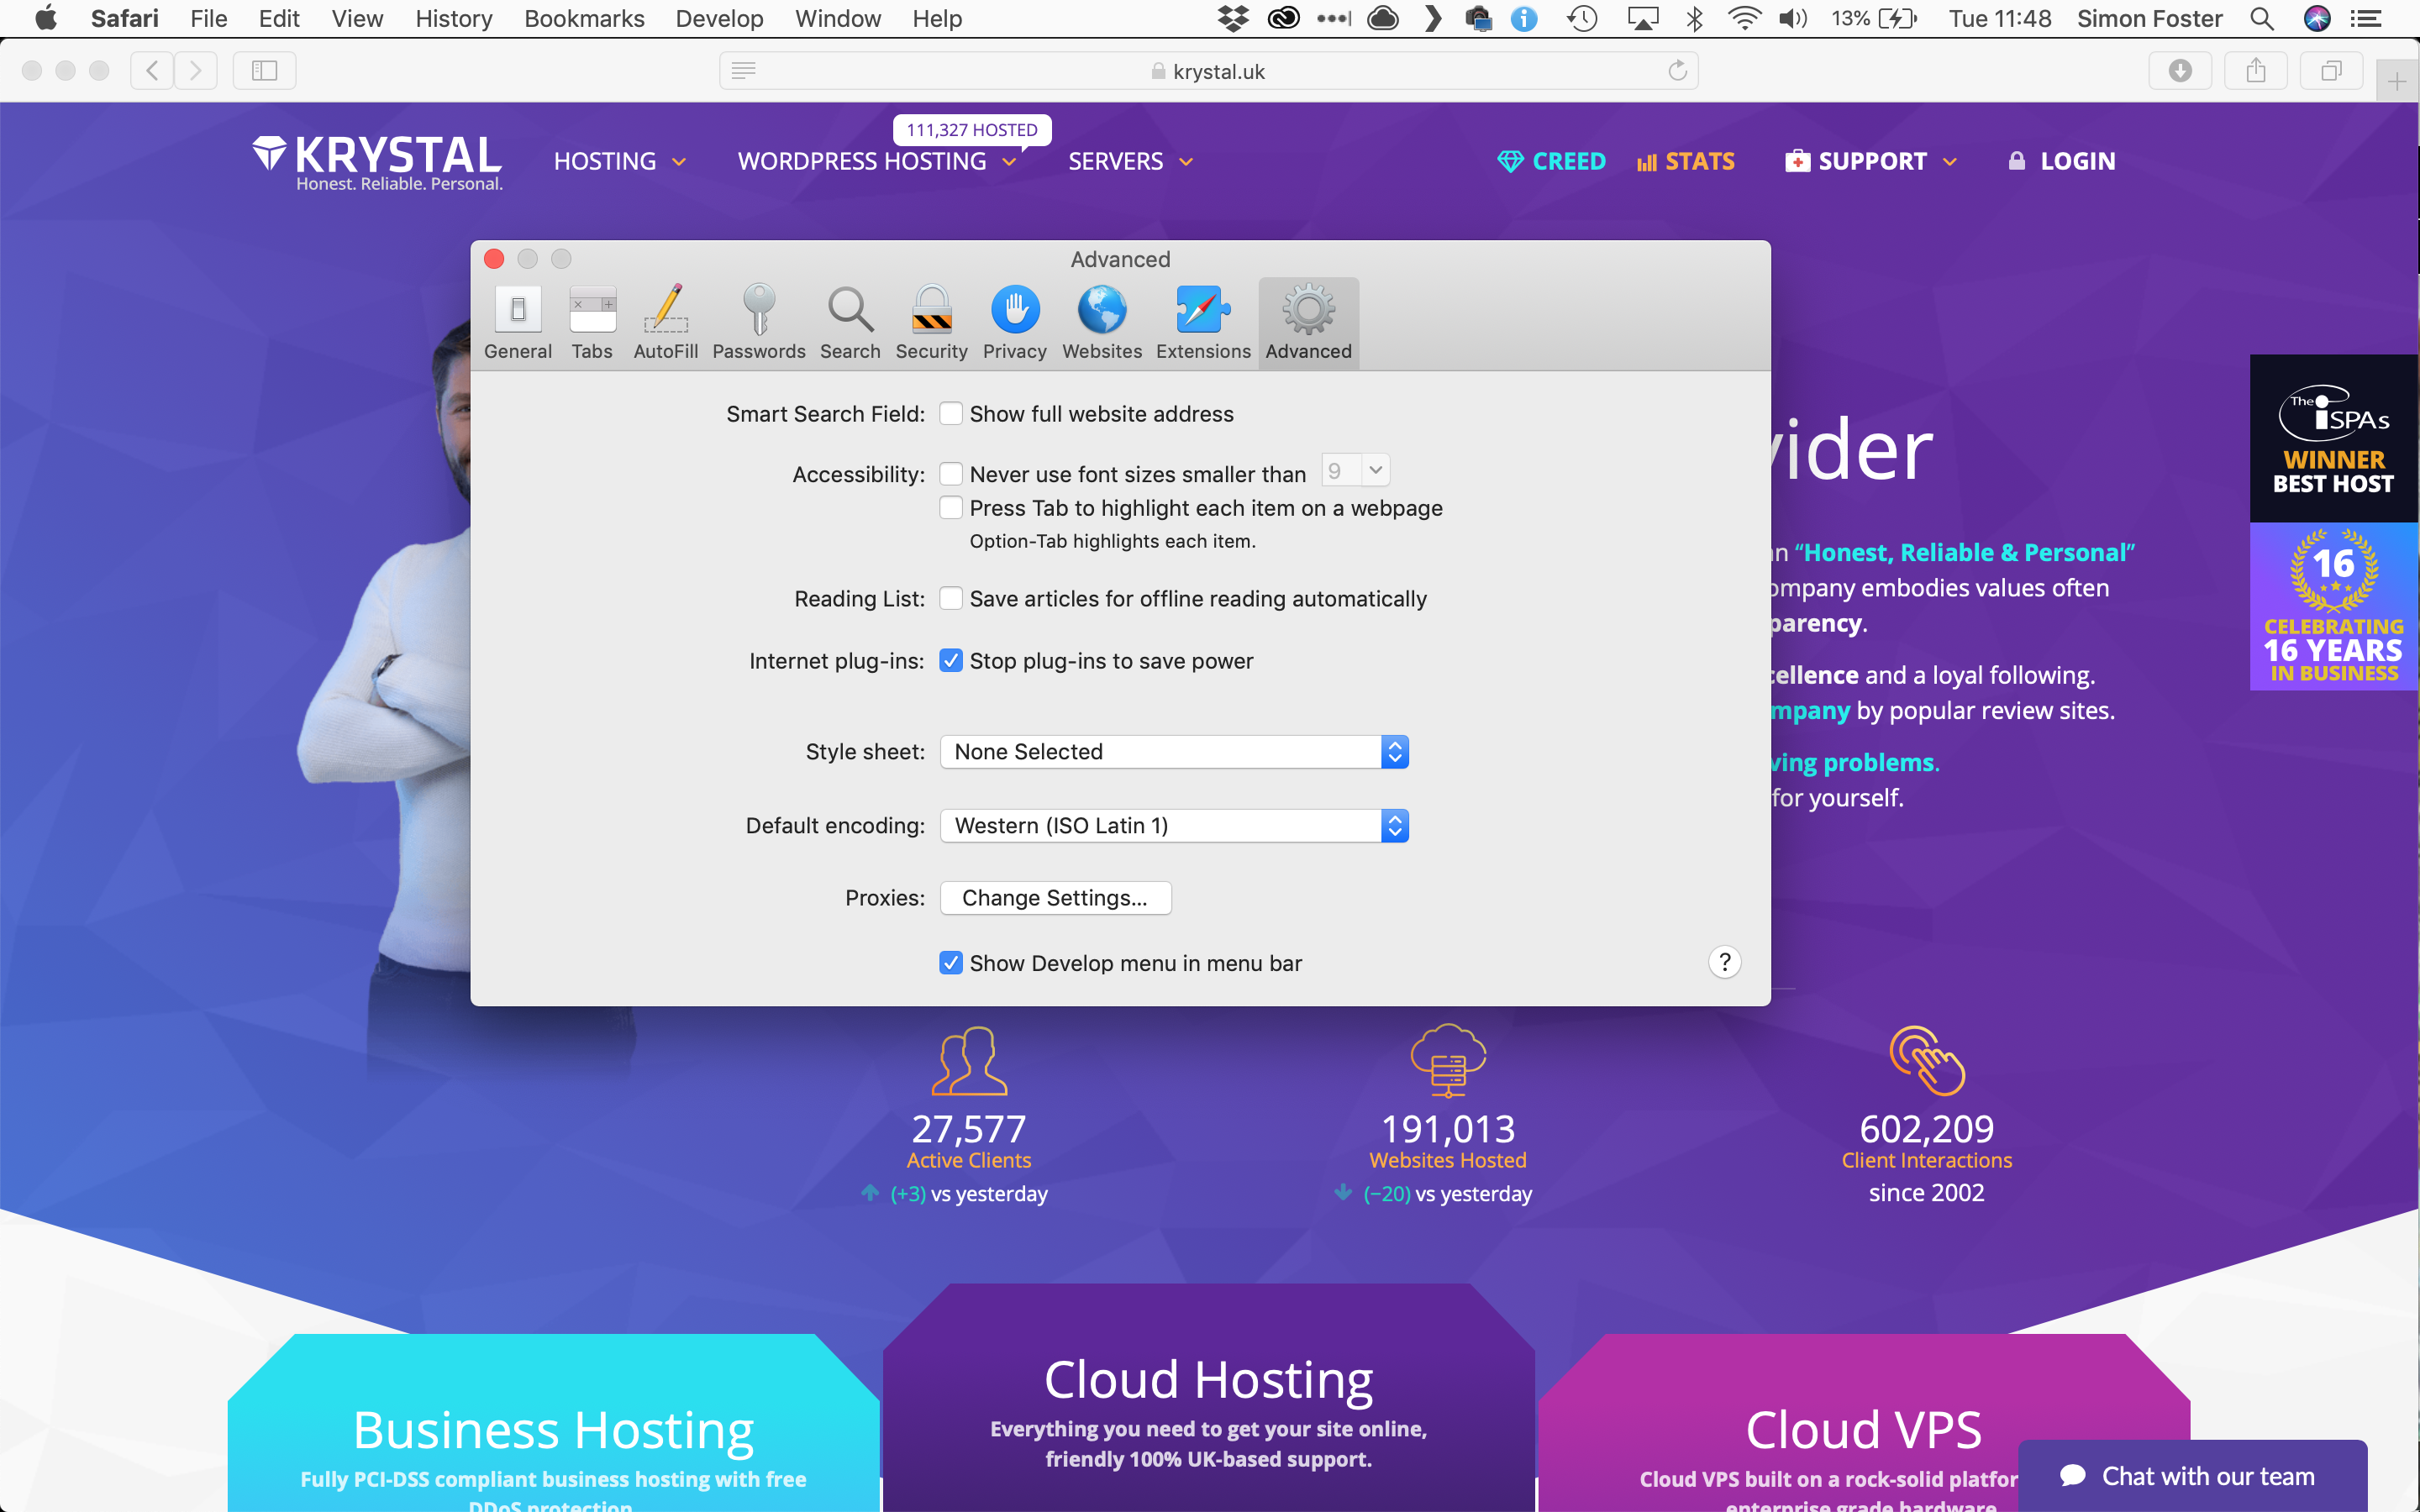
- Select the Advanced tab, and then tick Show Develop menu in the menu bar.
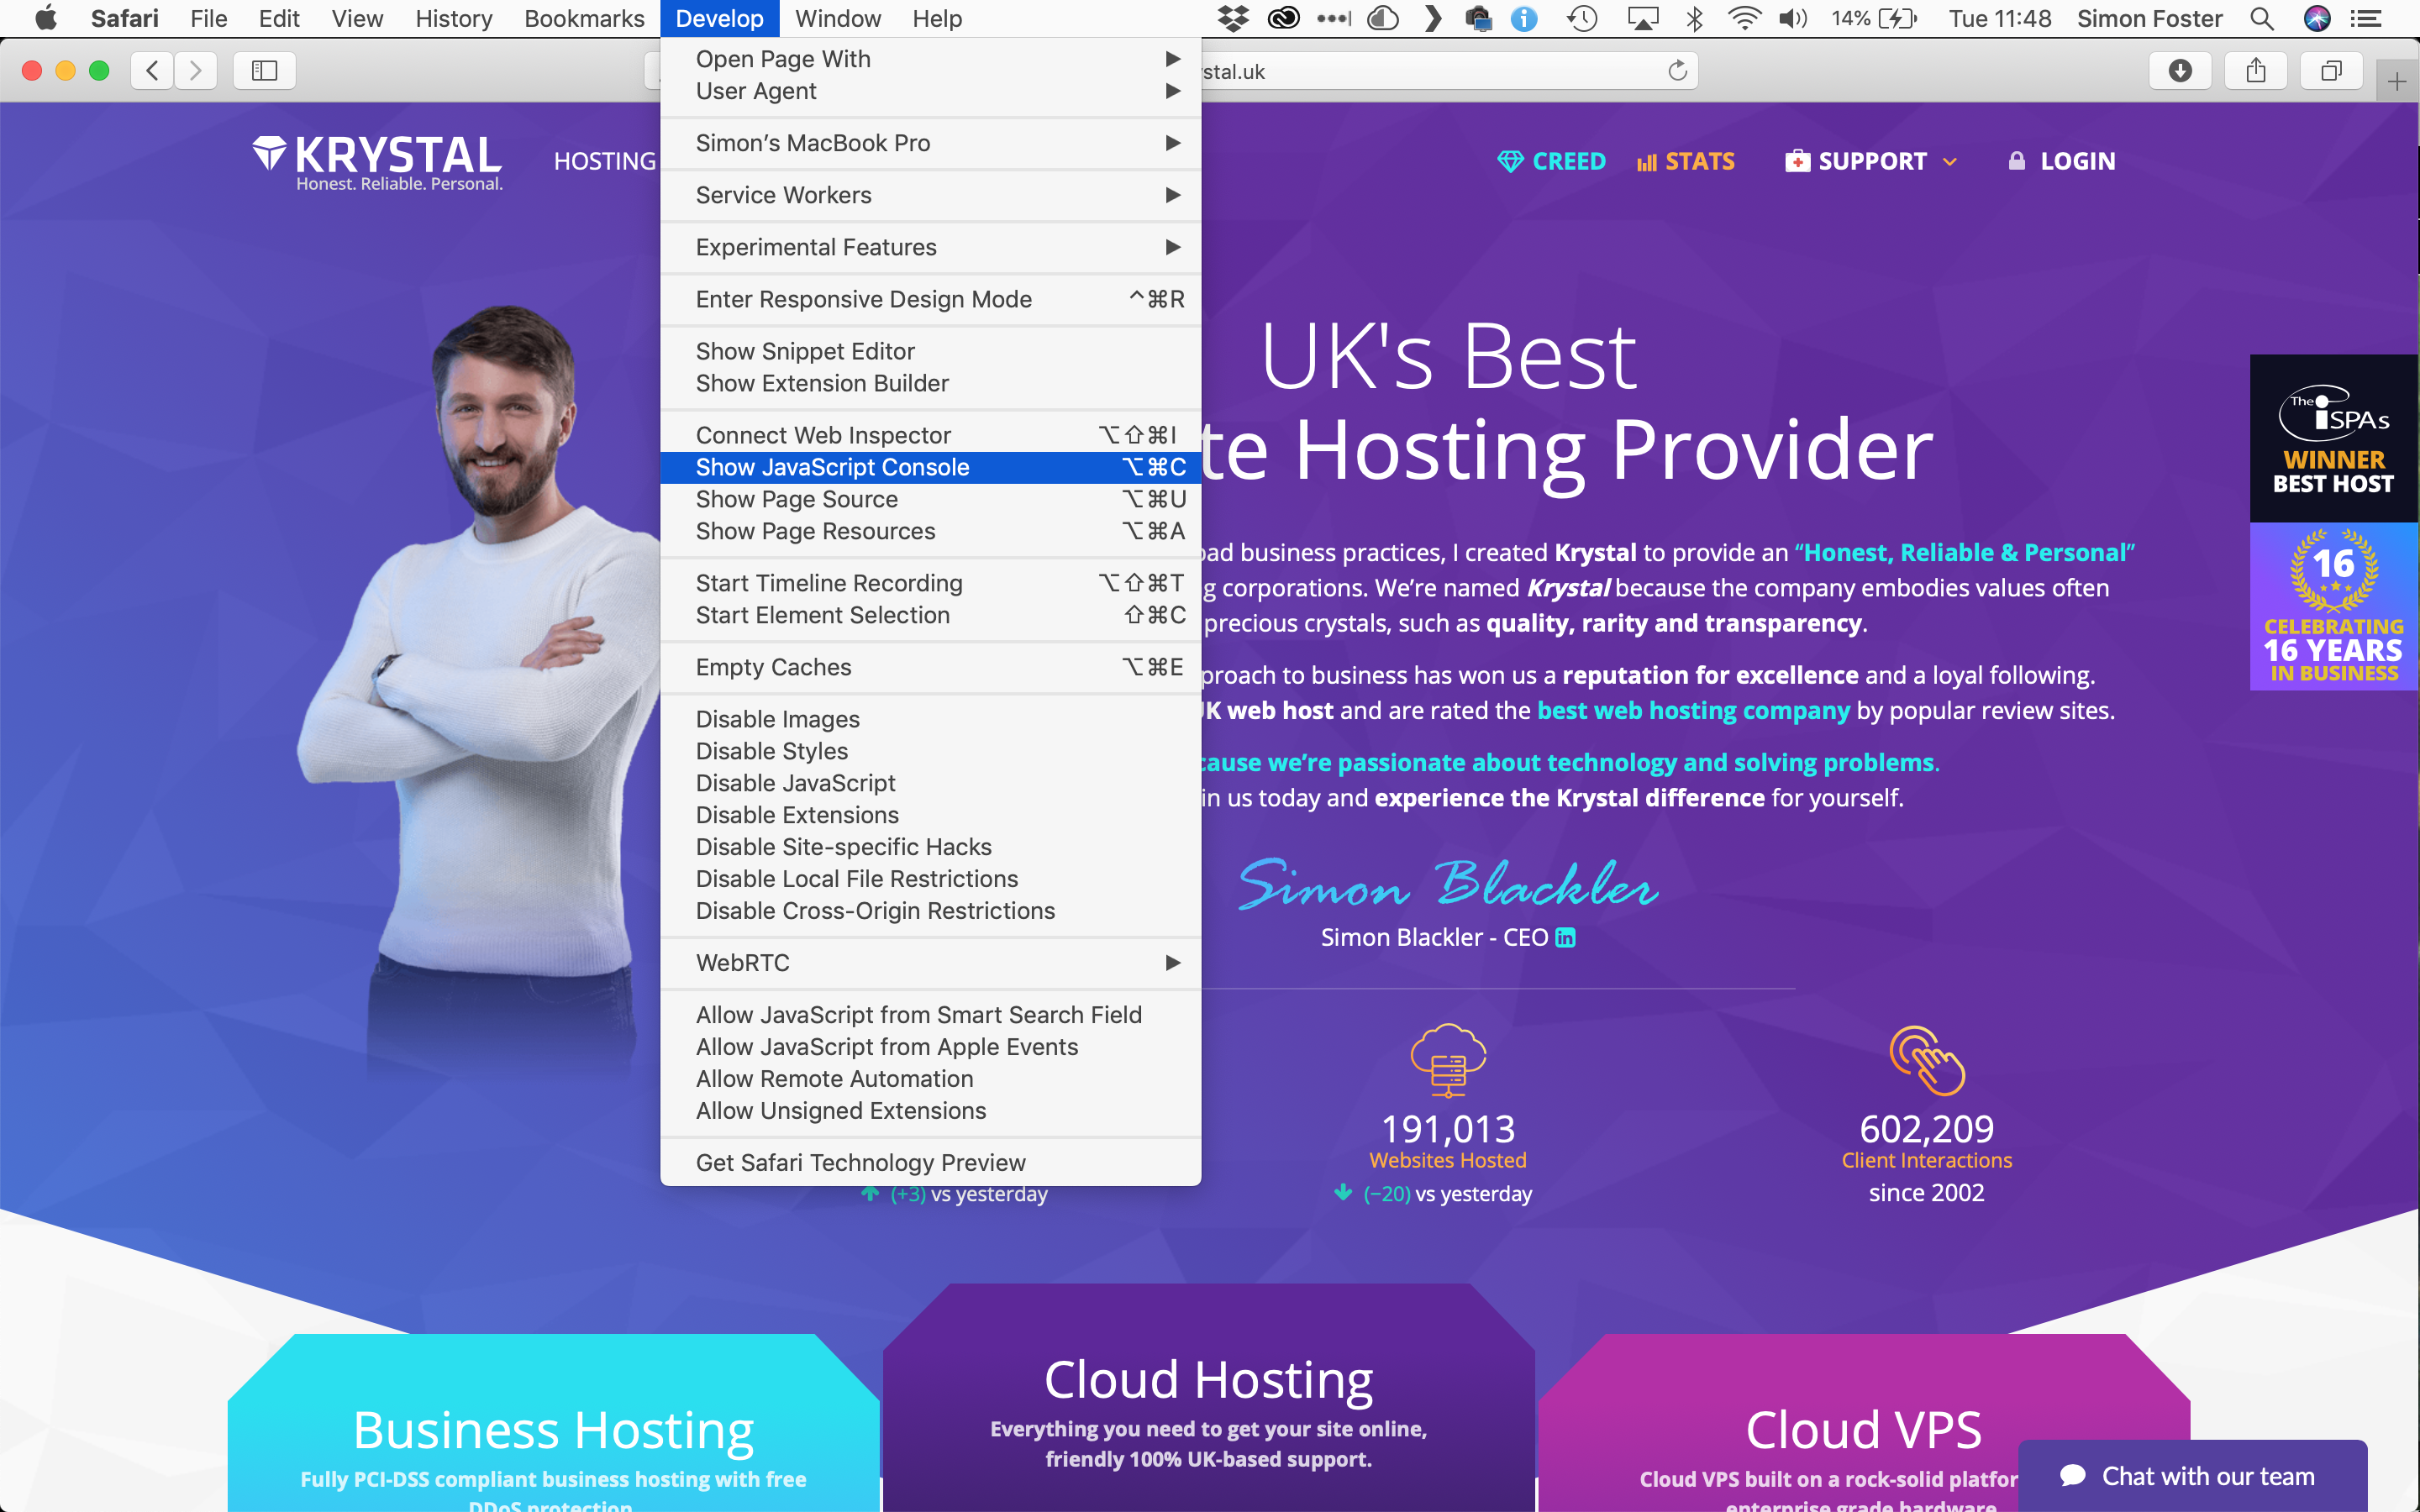
- Then select Show Javascript console from the Develop menu
- * *
- * *
Updated on: 24/01/2024
Thank you!